Modify Chart Display Settings
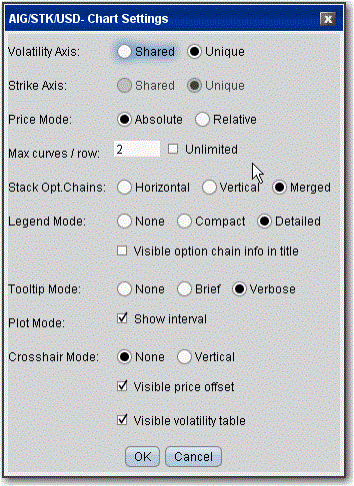
You can modify the pacing to control CPU usage, via the Pacing Control box. Also, you can make changes to certain display settings for the Volatility Curve plot, including using the same horizontal/vertical axis for two charts, defining the number of charts across a row, etc., using the Chart Settings box.
If you have selected a large number of expiries for Volatility Curve display, the model calculations may use up a large portion of CPU resources. You can slow down the rate at which values update (and reduce the load on CPU resources) using the Pacing Control box. You can modify pacing for the overall model calculation (Global), and for the Volatility Curve and Implied Vol data.
To modify pacing
- From the Settings menu, select Pacing.
- Modify default values to increase (lower values) or decrease (higher values) the refresh rate.
To modify chart settings
- From the Settings menu, select Chart settings.
If you use the top-level Settings menu, the settings will be applied globally. If you use the Settings menu from a Volatility Curve Pane and check Underlying specific settings, the settings will apply only to expiries on the underlying.

© 2016 Interactive Brokers - TWS用户指南